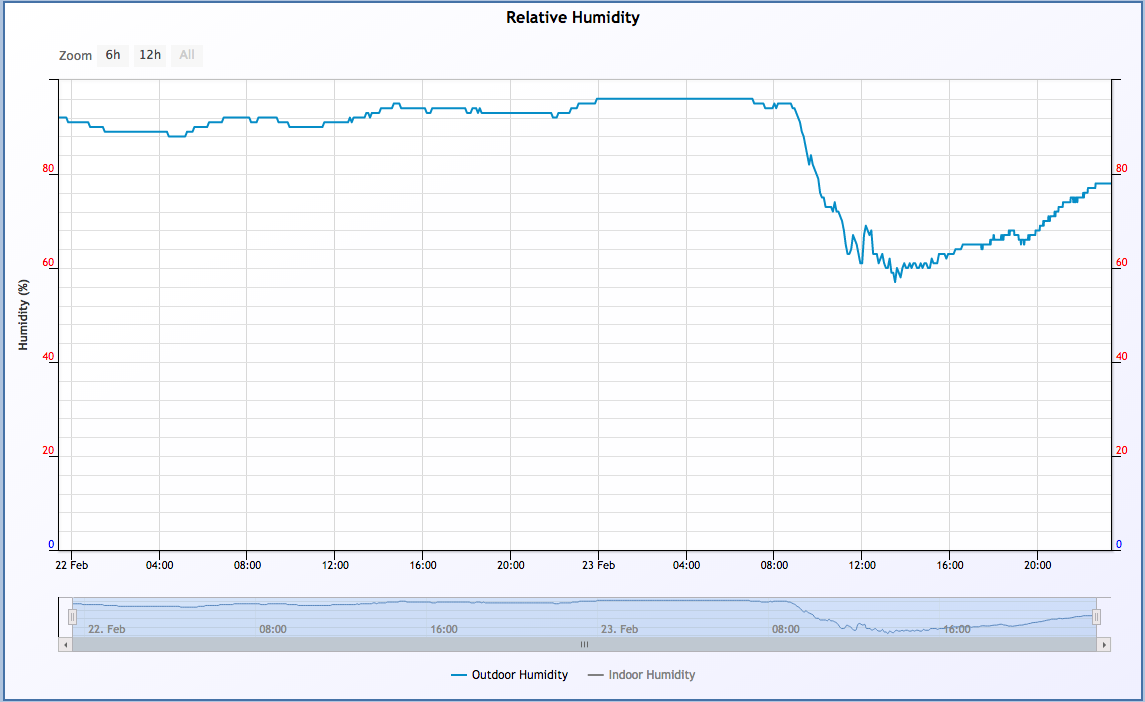
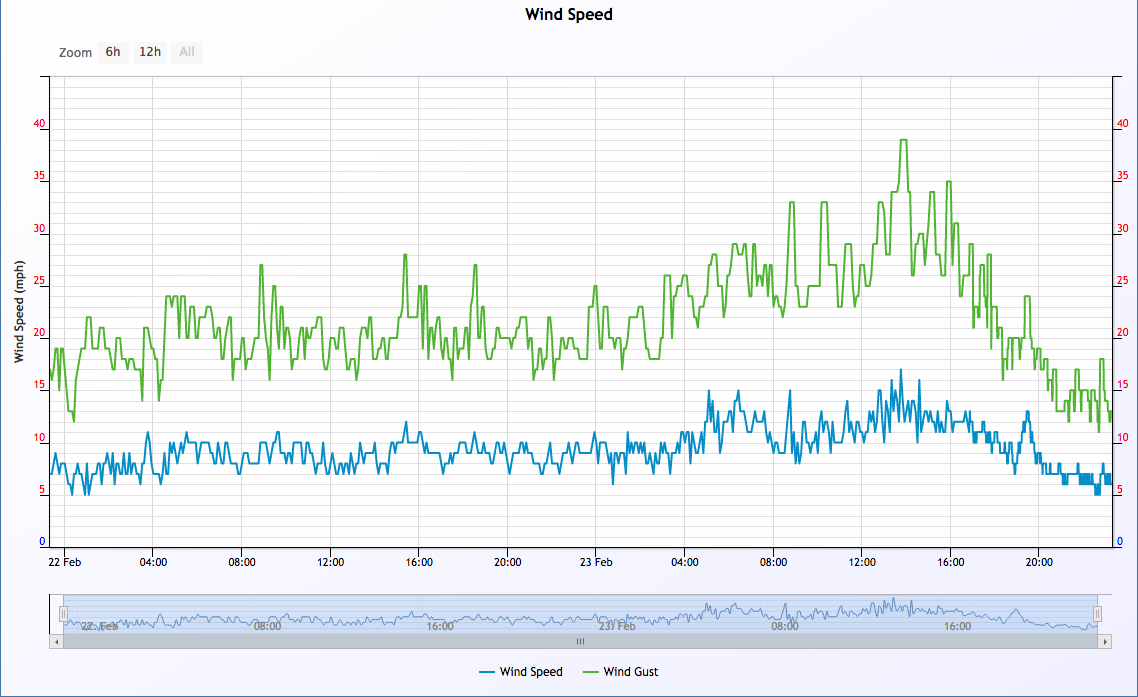
Sussex was not much affected by Storm Doris, but it’s passing is shown quite nicely in these data for atmospheric pressure, humidity and wind speed:
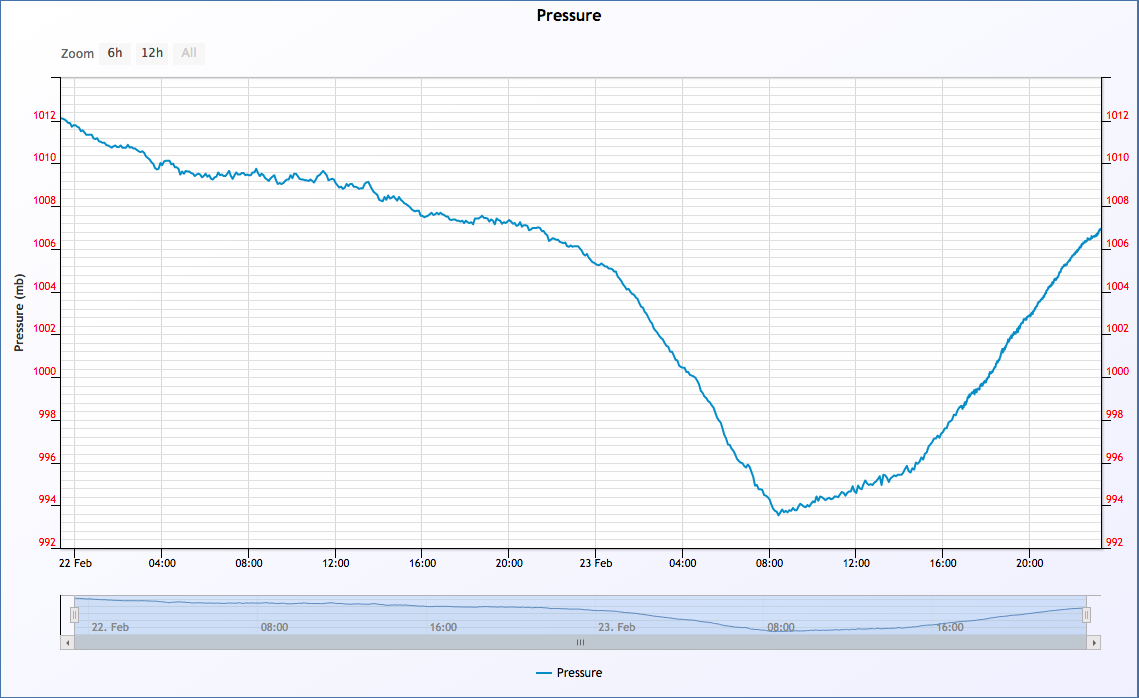
Notes & Observations from Nick Quinn, G0BAF
Sussex was not much affected by Storm Doris, but it’s passing is shown quite nicely in these data for atmospheric pressure, humidity and wind speed:
Not much evidence of Storm Barbara on the south coast other than a nice example of the passage of a cold front around 8.00pm on 2016 December 23.
Here are the plots: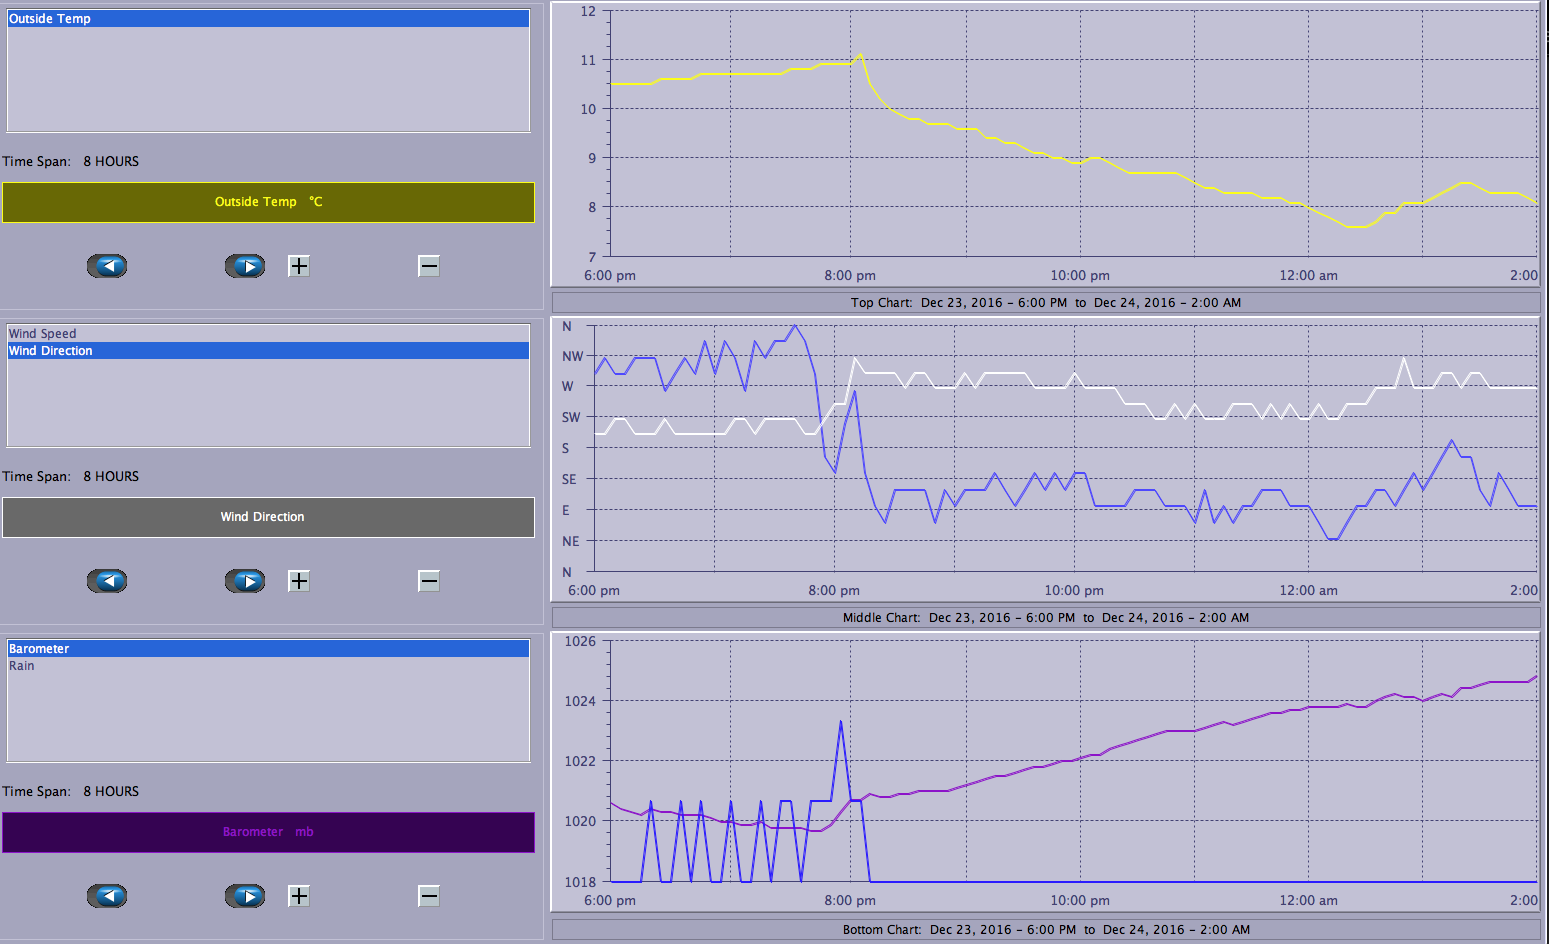
The top plot shows the change in temperature from very slowly rising to falling.
In the middle plot wind direction is in white, whilst wind speed is blue. Note veering of wind from SSW to WNW. Wind speed drops from around 12 mph to 5mph.
The lower plot shows clearly the change of atmospheric pressure from falling to rising (purple) and the cessation of rain (blue).
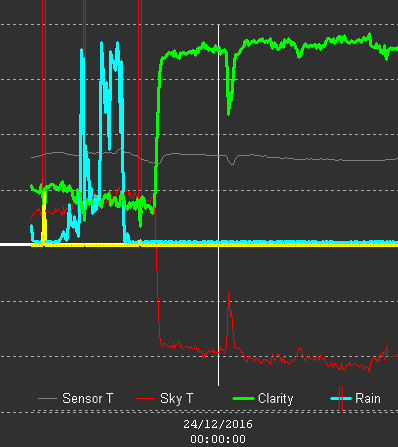
The plot from the Aurora Cloud Sensor shows the rain in more detail and also how the sky cleared an hour or so later – Clarity increases as the Sky Temperature drops.
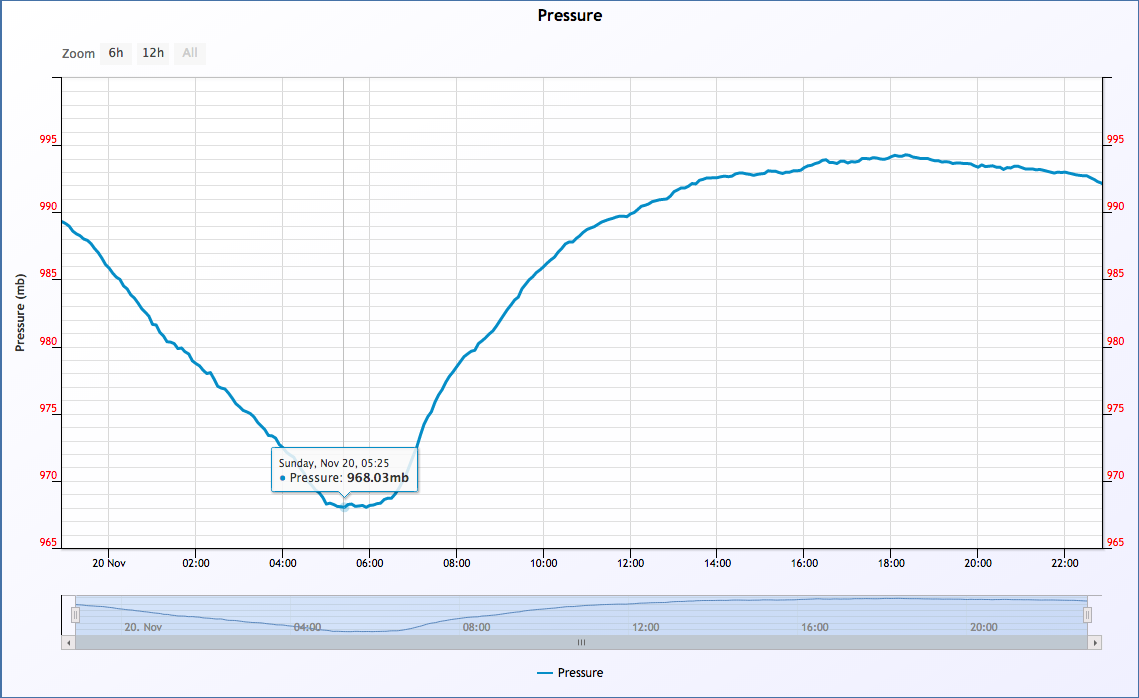
Here is today’s pressure chart as Storm Angus passed over this morning:
Observations from my weather station updated twice daily here: weather.njq.me.uk